Generalized Extreme Value (GEV) distribution
Generalized Extreme Value (GEV) Distribution is a limit distribution of properly normalized maxima of sequence of independent and identically
distributed random variables. It is specified by three parameters : location, shape and scale. Visit Wikipedia page for more information.
Functions
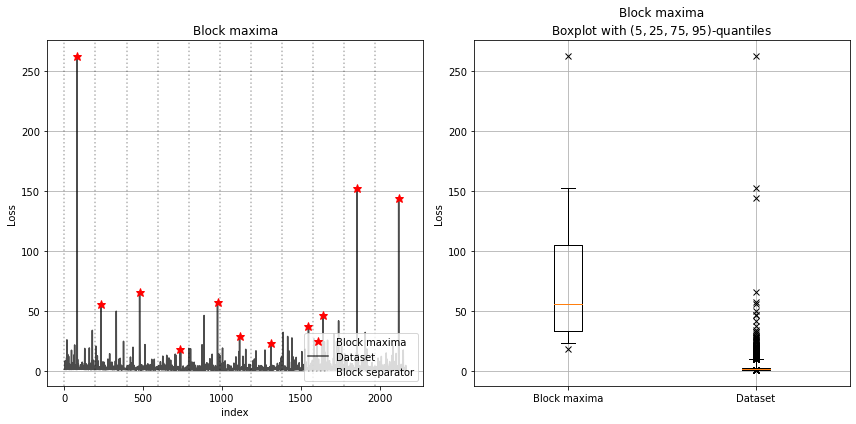
1. getBM(sample, period)
In Block Maxima method we divide the whole dataset into blocks and select the largest value in each block as an extreme value.
Parameters
sample : pandas dataframe
The whole dataset
period : string
The time period on basis of which the blocks are created. Eg - yearly, monthly, weekly and daily.
Returns
maxima_reset : pandas dataframe
Expand for source code
    #Block Maxima method for finding large values.
    def getBM(sample,period):

       #Obtain the maximas
        colname=list(sample)
        sample.iloc[:,0]= pd.to_datetime(sample.iloc[:,0])
        maxima = sample.resample(period, on=colname[0]).max()
        maxima_reset=maxima.reset_index(drop=True)
        series=pd.Series(sample.iloc[:,1])
        series.index.name=index
        dataset = Dataset(series)
        N_SAMPLES_PER_BLOCK = round(len(sample)/len(maxima_reset))
        block_maxima = BlockMaxima(dataset, N_SAMPLES_PER_BLOCK)

        #Plot the maximas
        fig, (ax1, ax2) = plt.subplots(1, 2, figsize=(12, 6))
        block_maxima.plot_block_maxima(ax1)
        block_maxima.plot_block_maxima_boxplot(ax2)
        fig.tight_layout()
        plt.show()

        #Return the maximas
        return maxima_reset
Example
   from ExtremeLy import extremely as ely
   #Here Y means Yearly, we can pass M for monthly, W for weekly and D for daily.
   maxima=ely.getBM(sample=data,period="Y")
   maxima
Output
   	Date 	Loss
0 	1980-12-31 	263.250366
1 	1981-12-31 	56.225426
2 	1982-12-31 	65.707491
3 	1983-12-30 	13.348165
4 	1984-12-31 	19.162304
5 	1985-12-29 	57.410636
6 	1986-12-30 	29.026037
7 	1987-12-31 	32.467532
8 	1988-12-26 	47.019521
9 	1989-12-31 	152.413209
10 	1990-12-31 	144.657591
2. gevfit(sample, fit_method=’mle’, ci=0, ci_method=’delta’)
GEV is a limit distribution of properly normalized maxima of sequence of independent and identically distributed random variables. It is parameterized by scale, shape and location parameters.
Parameters
sample : pandas dataframe
maximas obtained from Block Maxima method
fit_method : string
Estimation method like Maximum Likelihood Estimation or Method of Moments. Default is MLE.
ci : float
Confidence interval. Default is 0.
ci_method : string
Method used for Confidence Interval like Delta or Bootstrap. Default is Delta.
Returns
model : object
Object containing the information about GEV fit.
Expand for source code
     #Using classic model of skextreme for GEV fitting
     model = sk.models.classic.GEV(sample.iloc[:,1], fit_method = fit_method, ci = ci,ci_method=ci_method)
     return model
Example
#Fitting the GEV distribution with maxima values.
#Here, default fit_method is MLE and default Confidence interval method is delta.
fit=ely.gevfit(sample=maxima,fit_method="mle",ci=0,ci_method="delta")
3. gevparams(model)
Accesing estimated distribution parameters from the GEV fit.
Parameters
model : object
Object containing the information about GEV fit.
Returns
OrderedDict
Returns estimated distribution parameters.
Expand for source code
     #Return the estimated parameters
     return model.params
Example
#Getting estimated distribution parameters for GEV fit.
params=ely.gevparams(model=fit)
params
Output
OrderedDict([('shape', -0.6384049125307144),
         ('location', 37.79353853187126),
         ('scale', 28.93607752286071)])
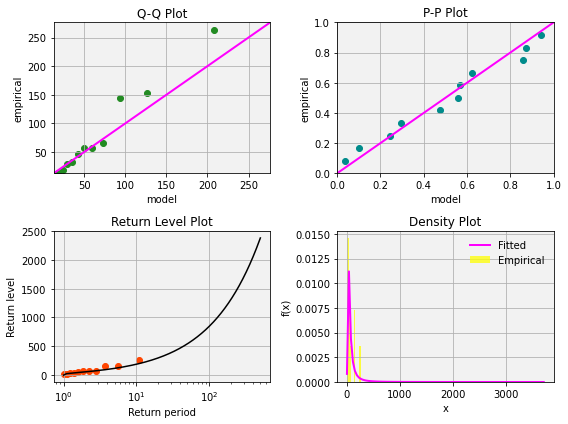
4. gevsummary(model)
Plotting plots like QQplot, PPplot, Return Level plot and density plot for the GEV model.
Parameters
model : object
Object containing the information about GEV fit.
Returns
None
Expand for source code
     #Display all the plots together
     model.plot_summary()
Example
#Summarizing the GEV model with various plots like QQplot, PPplot,
#Return Level Plot and Data Probability density plot
ely.gevsummary(model=fit)
Output